
D2L: Sequential Model
Sequential Model
Concept and Principle
序列模型是考虑时间信息的模型
序列数据
- 数据带有时序结构,如电影的评价随时间变化
- 电影拿奖后评分上升
- 导演、演员负面报道后评分下降
- 数据带有时序结构,如电影的评价随时间变化
统计工具
- 将序列中每个元素看作随机变量,显然他们不是独立的
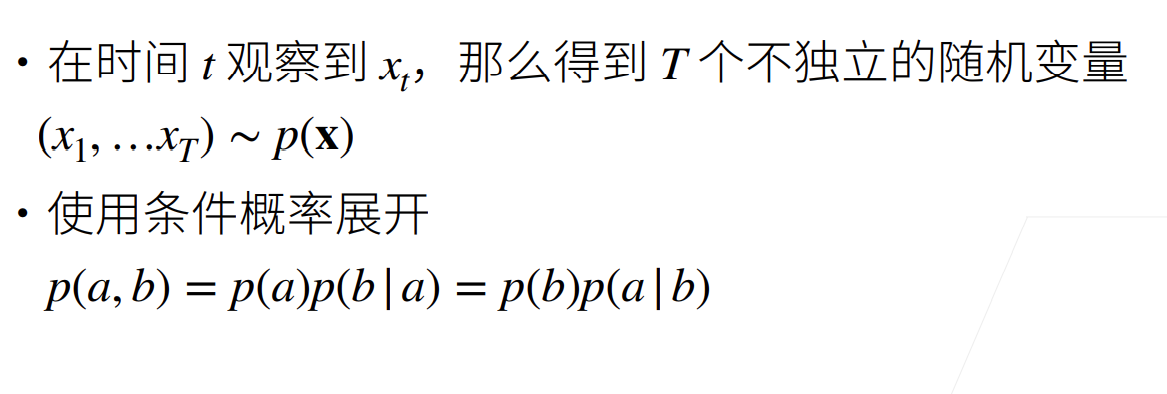
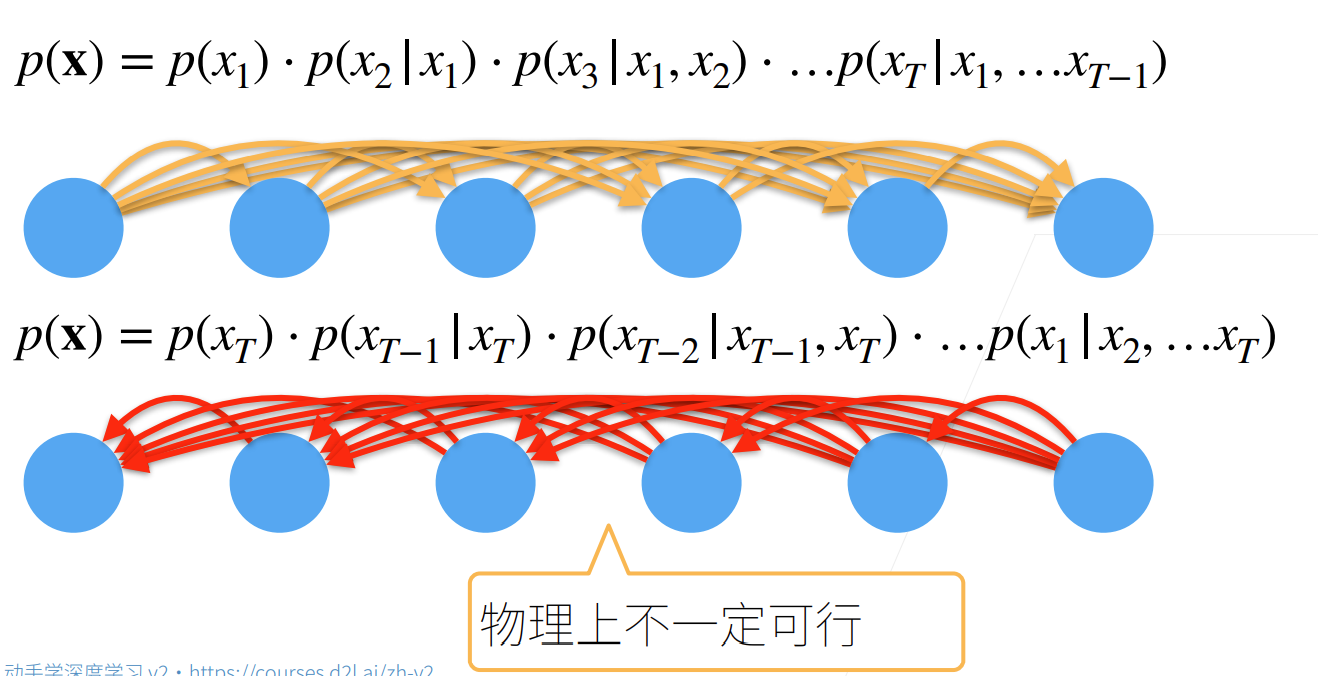
- 在实际操作中,时序序列一般只能正向建模去预测
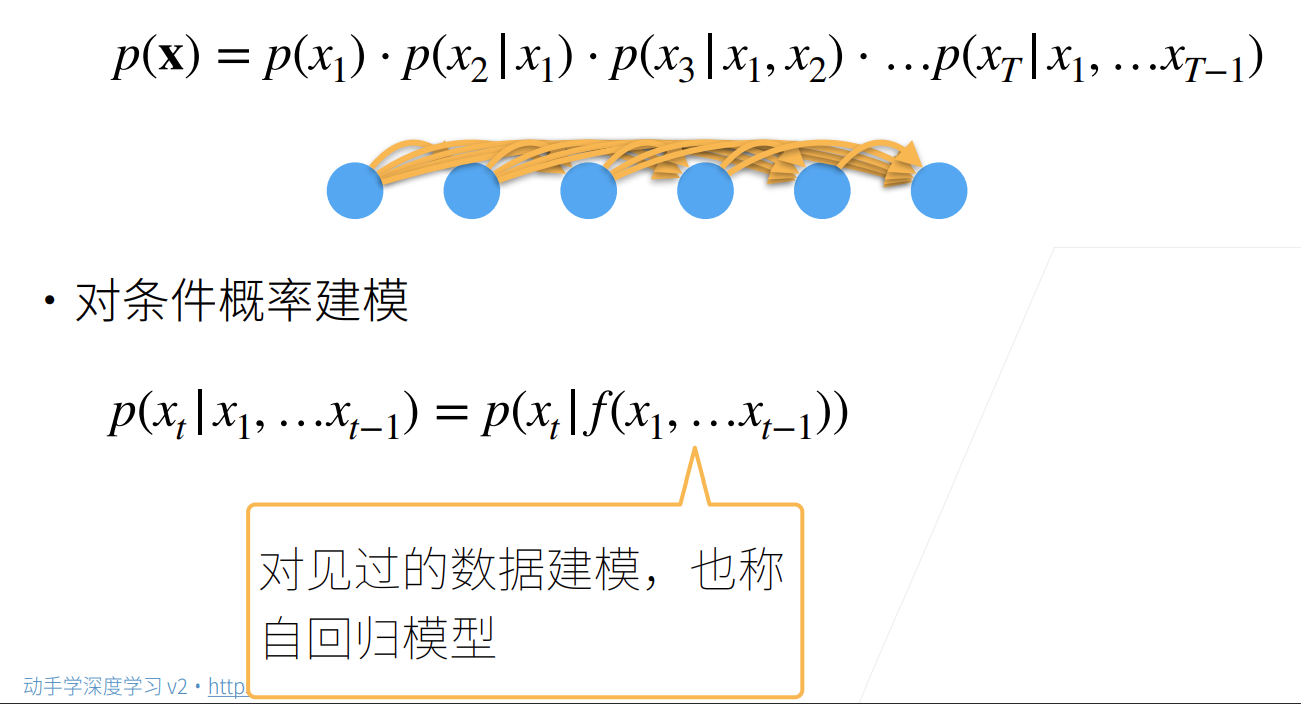
- 要使用序列模型预测T时刻x的概率,核心是求T时刻的条件概率(似然),这里的f可看作神经网络,神经网络将训练集建模。自回归指的是用数据对见过的数据建模(因为最后预测也是在预测相同的数据),与非序列模型用数据对独立于数据的标签建模不同。
- 具体如何建模?
- 马尔科夫假设
当前预测的数据只跟过去的tau个数据相关,tau是一个固定常数。假设x是标量数据,此时只需要将其看作回归问题,使用MLP把tau个x当作特征训练得到t时刻标量x。MLP进行梯度优化的过程便是最大化似然概率的过程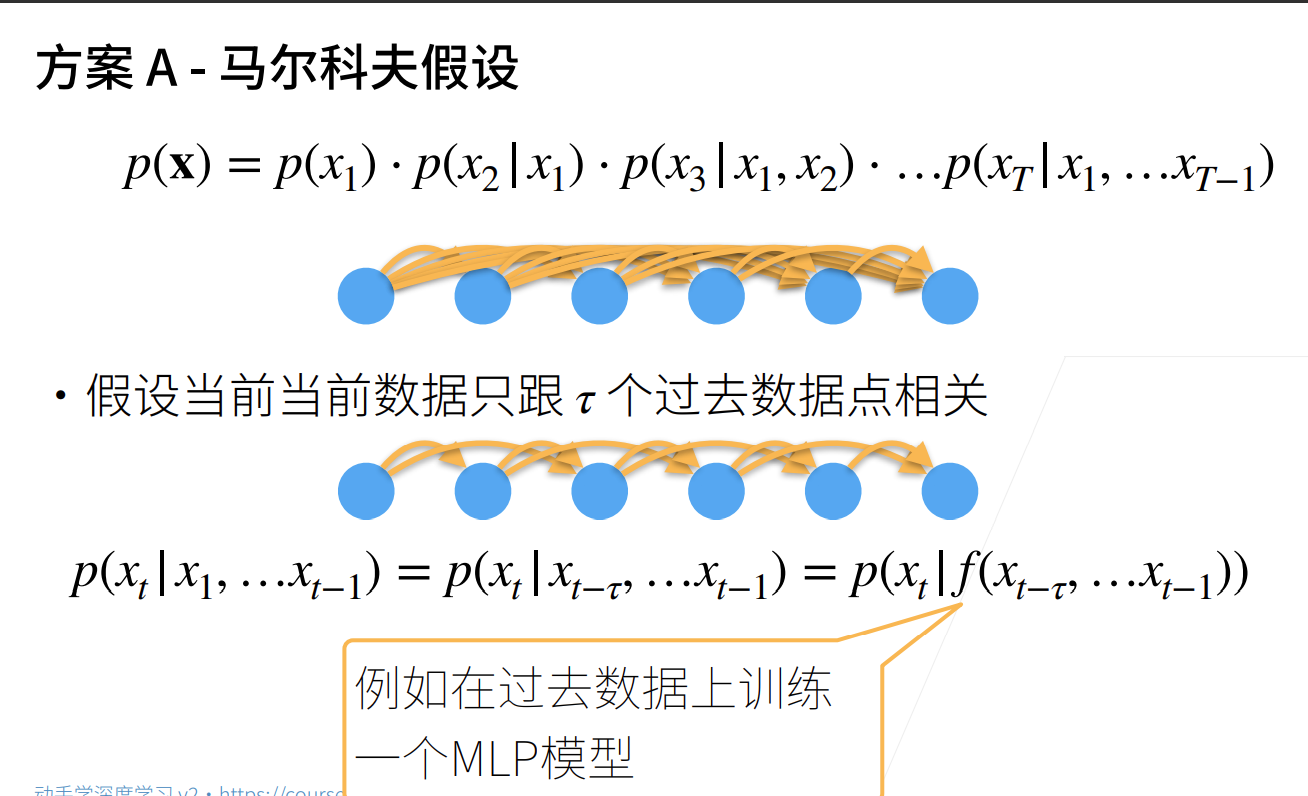
- 潜变量模型
引入一个可不断更新的潜变量用于概括历史信息,使得建模更加简单(RNN)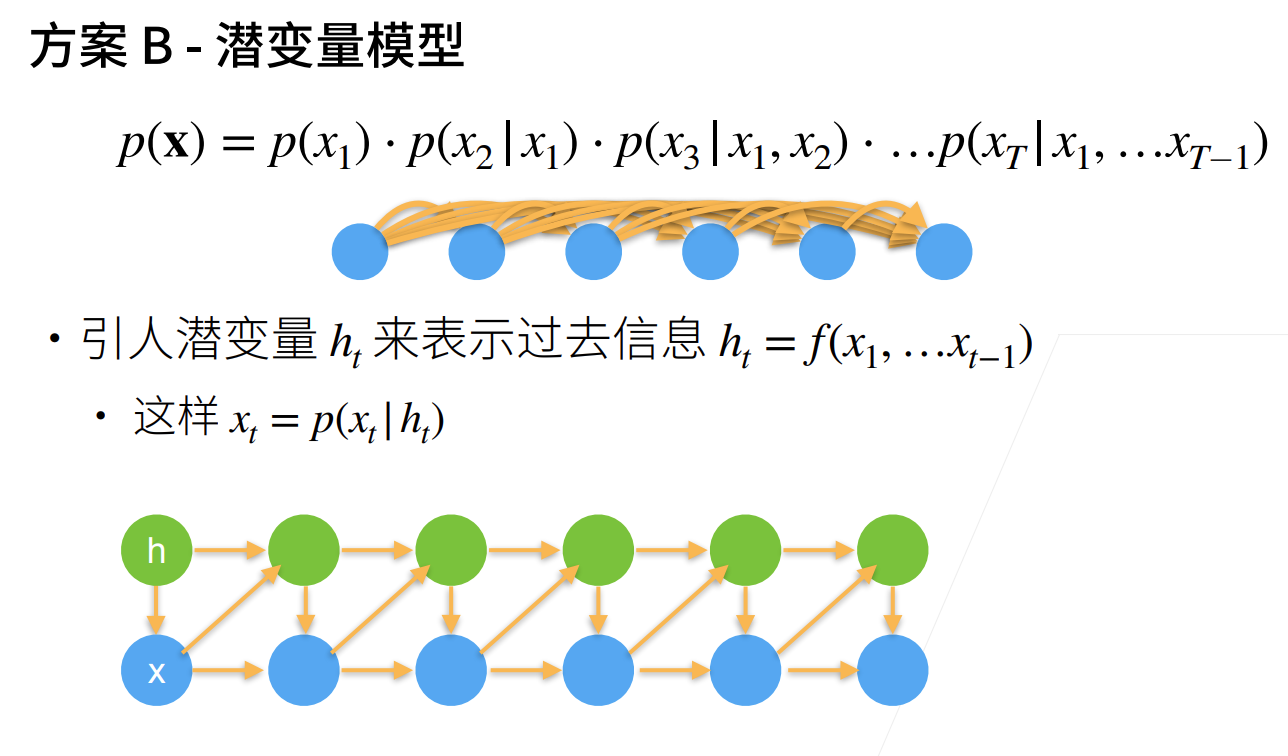
- 马尔科夫假设
- 将序列中每个元素看作随机变量,显然他们不是独立的
Implementation
- 马尔可夫假设+MLP
1
2
3
4
5
6
7
8
9
10
11
12
13
14
15
16
17
18
19
20
21
22
23
24
25
26
27
28
29
30
31
32
33
34
35
36
37
38
39
40
41
42
43
44
45
46
47
48
49
50
51
52
53
54
55
56
57
58
59
60
61
62
63
64
65
66
67
68
69
70
71
72
73
74
75
76
77
78
79
80
81
82
83
84
85
86
87
import torch
from torch import nn
from torch.utils.data import TensorDataset
from torch.utils.data.dataloader import DataLoader
from torch import optim
import math
# 使用正弦函数加上噪声生成序列数据
T=1000
time=torch.arange(1,T+1,dtype=torch.float32)
data=torch.sin(0.01*time)+torch.normal(0,0.1,time.shape)
# 将数据映射为数据对
tau=4
labels=data[tau:].view(-1,1)
features=torch.zeros(T-tau,tau)
for i in range(tau):
features[:,i]=data[i:T-tau+i]
train_dataset=TensorDataset(features[:600],labels[:600])
test_dataset=TensorDataset(features[600:],labels[600:])
train_iter=DataLoader(train_dataset,batch_size=16)
test_iter=DataLoader(test_dataset,batch_size=16)
net=nn.Sequential(
nn.Linear(4,32),
nn.Dropout(0.1),
nn.ReLU(),
nn.Linear(32,16),
nn.ReLU(),
nn.Linear(16,1)
)
loss_f=nn.MSELoss()
opt=optim.Adam(net.parameters())
try:
net.load_state_dict(torch.load("9.params"))
except:
for epoch in range(100):
train_loss=[]
test_loss=[]
for X,y in train_iter:
out=net(X)
l=loss_f(out,y)
l.backward()
train_loss.append(l.item())
opt.step()
opt.zero_grad()
with torch.no_grad():
for X,y in test_iter:
out=net(X)
l=loss_f(out,y)
test_loss.append(l.item())
print(f"{epoch+1},{sum(train_loss)} {sum(test_loss)}")
torch.save(net.state_dict(),"9.params")
# 使用测试集预测
from matplotlib import pyplot as plt
t=600
steps=396
plt.plot([i for i in range(t,t+steps)],net(features[600:]).view(-1).detach().numpy())
# 使用预测值进行多步预测
win=[math.sin(i*0.01) for i in range(t-4,t)]
true=[]
pred=[]
for i in range(steps):
X=torch.tensor(win,dtype=torch.float32)
out=net(X)
truth=math.sin((t+i)*0.01)
true.append(truth);pred.append(out.item())
# print(out.item(),t)
win.pop(0)
win.append(out)
plt.plot([i for i in range(t,t+steps)],pred)
plt.plot([i for i in range(t,t+steps)],true)
plt.show()
Comment